Model Properties
Rigid Bodies
All solid element rigid bodies were initially modelled with aluminium properties. The density of the rigid bodies in the lower extremity was subsequently adjusted to achieve the correct total mass for each model. This adjustment differed by model due to variations in constraints and measured inertia:
- In the 50F model, the density of all lower extremity rigid parts (except the femur head) was increased.
- In the 50M model, the density of only the femur head was increased.
PUR Foam
The PUR foam was modelled with MAT_LOW_DESNITY_FOAM. A density of 450 kg/m3 was assigned to all body parts and subsequently increased to reach the target mass. The table below lists the densities for different body regions:
| Density of PUR foam | FE SET 50F [kg/m3] | FE SET 50M [kg/m3] |
|---|---|---|
| Head | 450 | 450 |
| Arms | 552 | 1281 |
| Torso & Abdomen | 1111 | 695 |
| Pelvis | 450 | 450 |
| Upper Thigh | 450 | 1283 |
| Legs (except upper thigh) | 601 | 1283 |
Material Quantification
The PUR foam material properties were quantified using a drop test. A rigid spherical impactor was dropped from heights of 100 mm, 200 mm, and 300 mm onto a cylindrical foam sample that measured 150 mm in diameter and 100 mm in length, see figure below.
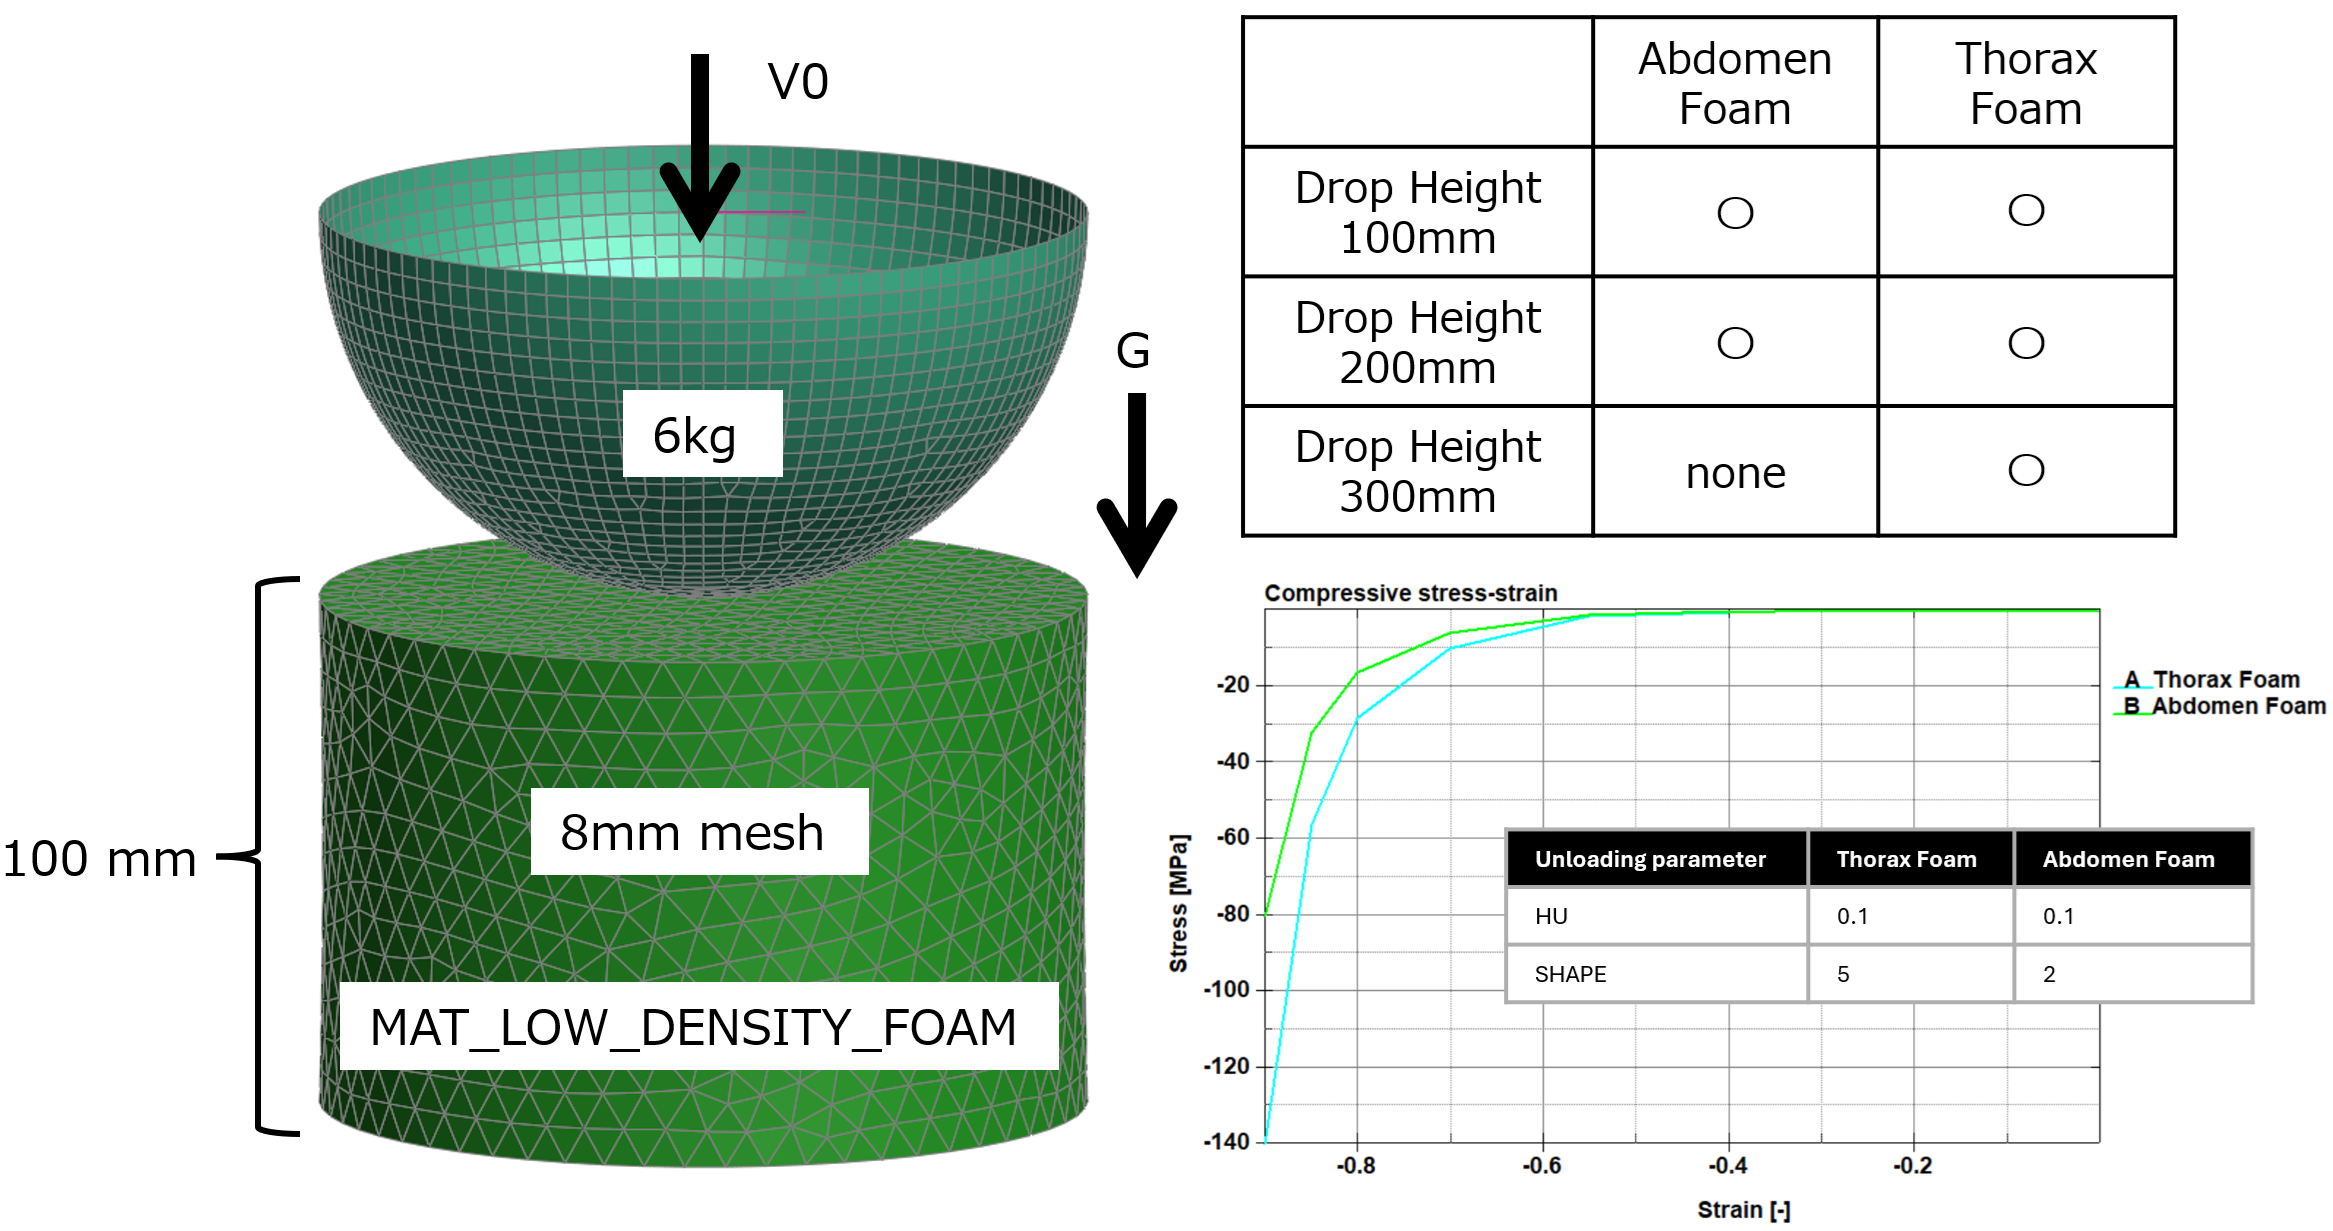
Results from the test and simulations will be made available when they have been published.
Mechanical Joints
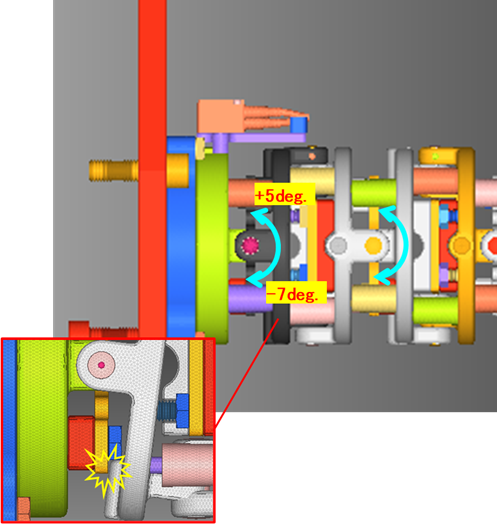
The mechanical joints are modelled between the rigid bodies using CONSTRAINED_JOINT and CONSTRAINED_JOINT_STIFFNESS_GENERALIZED. A frictional torque corresponding to a coefficient of friction of 0.2 is applied to all joints. Stop angles are set according to the physical articulation limits, derived from the CAD data (as demonstrated by the lowest lumbar joint in the figure below).
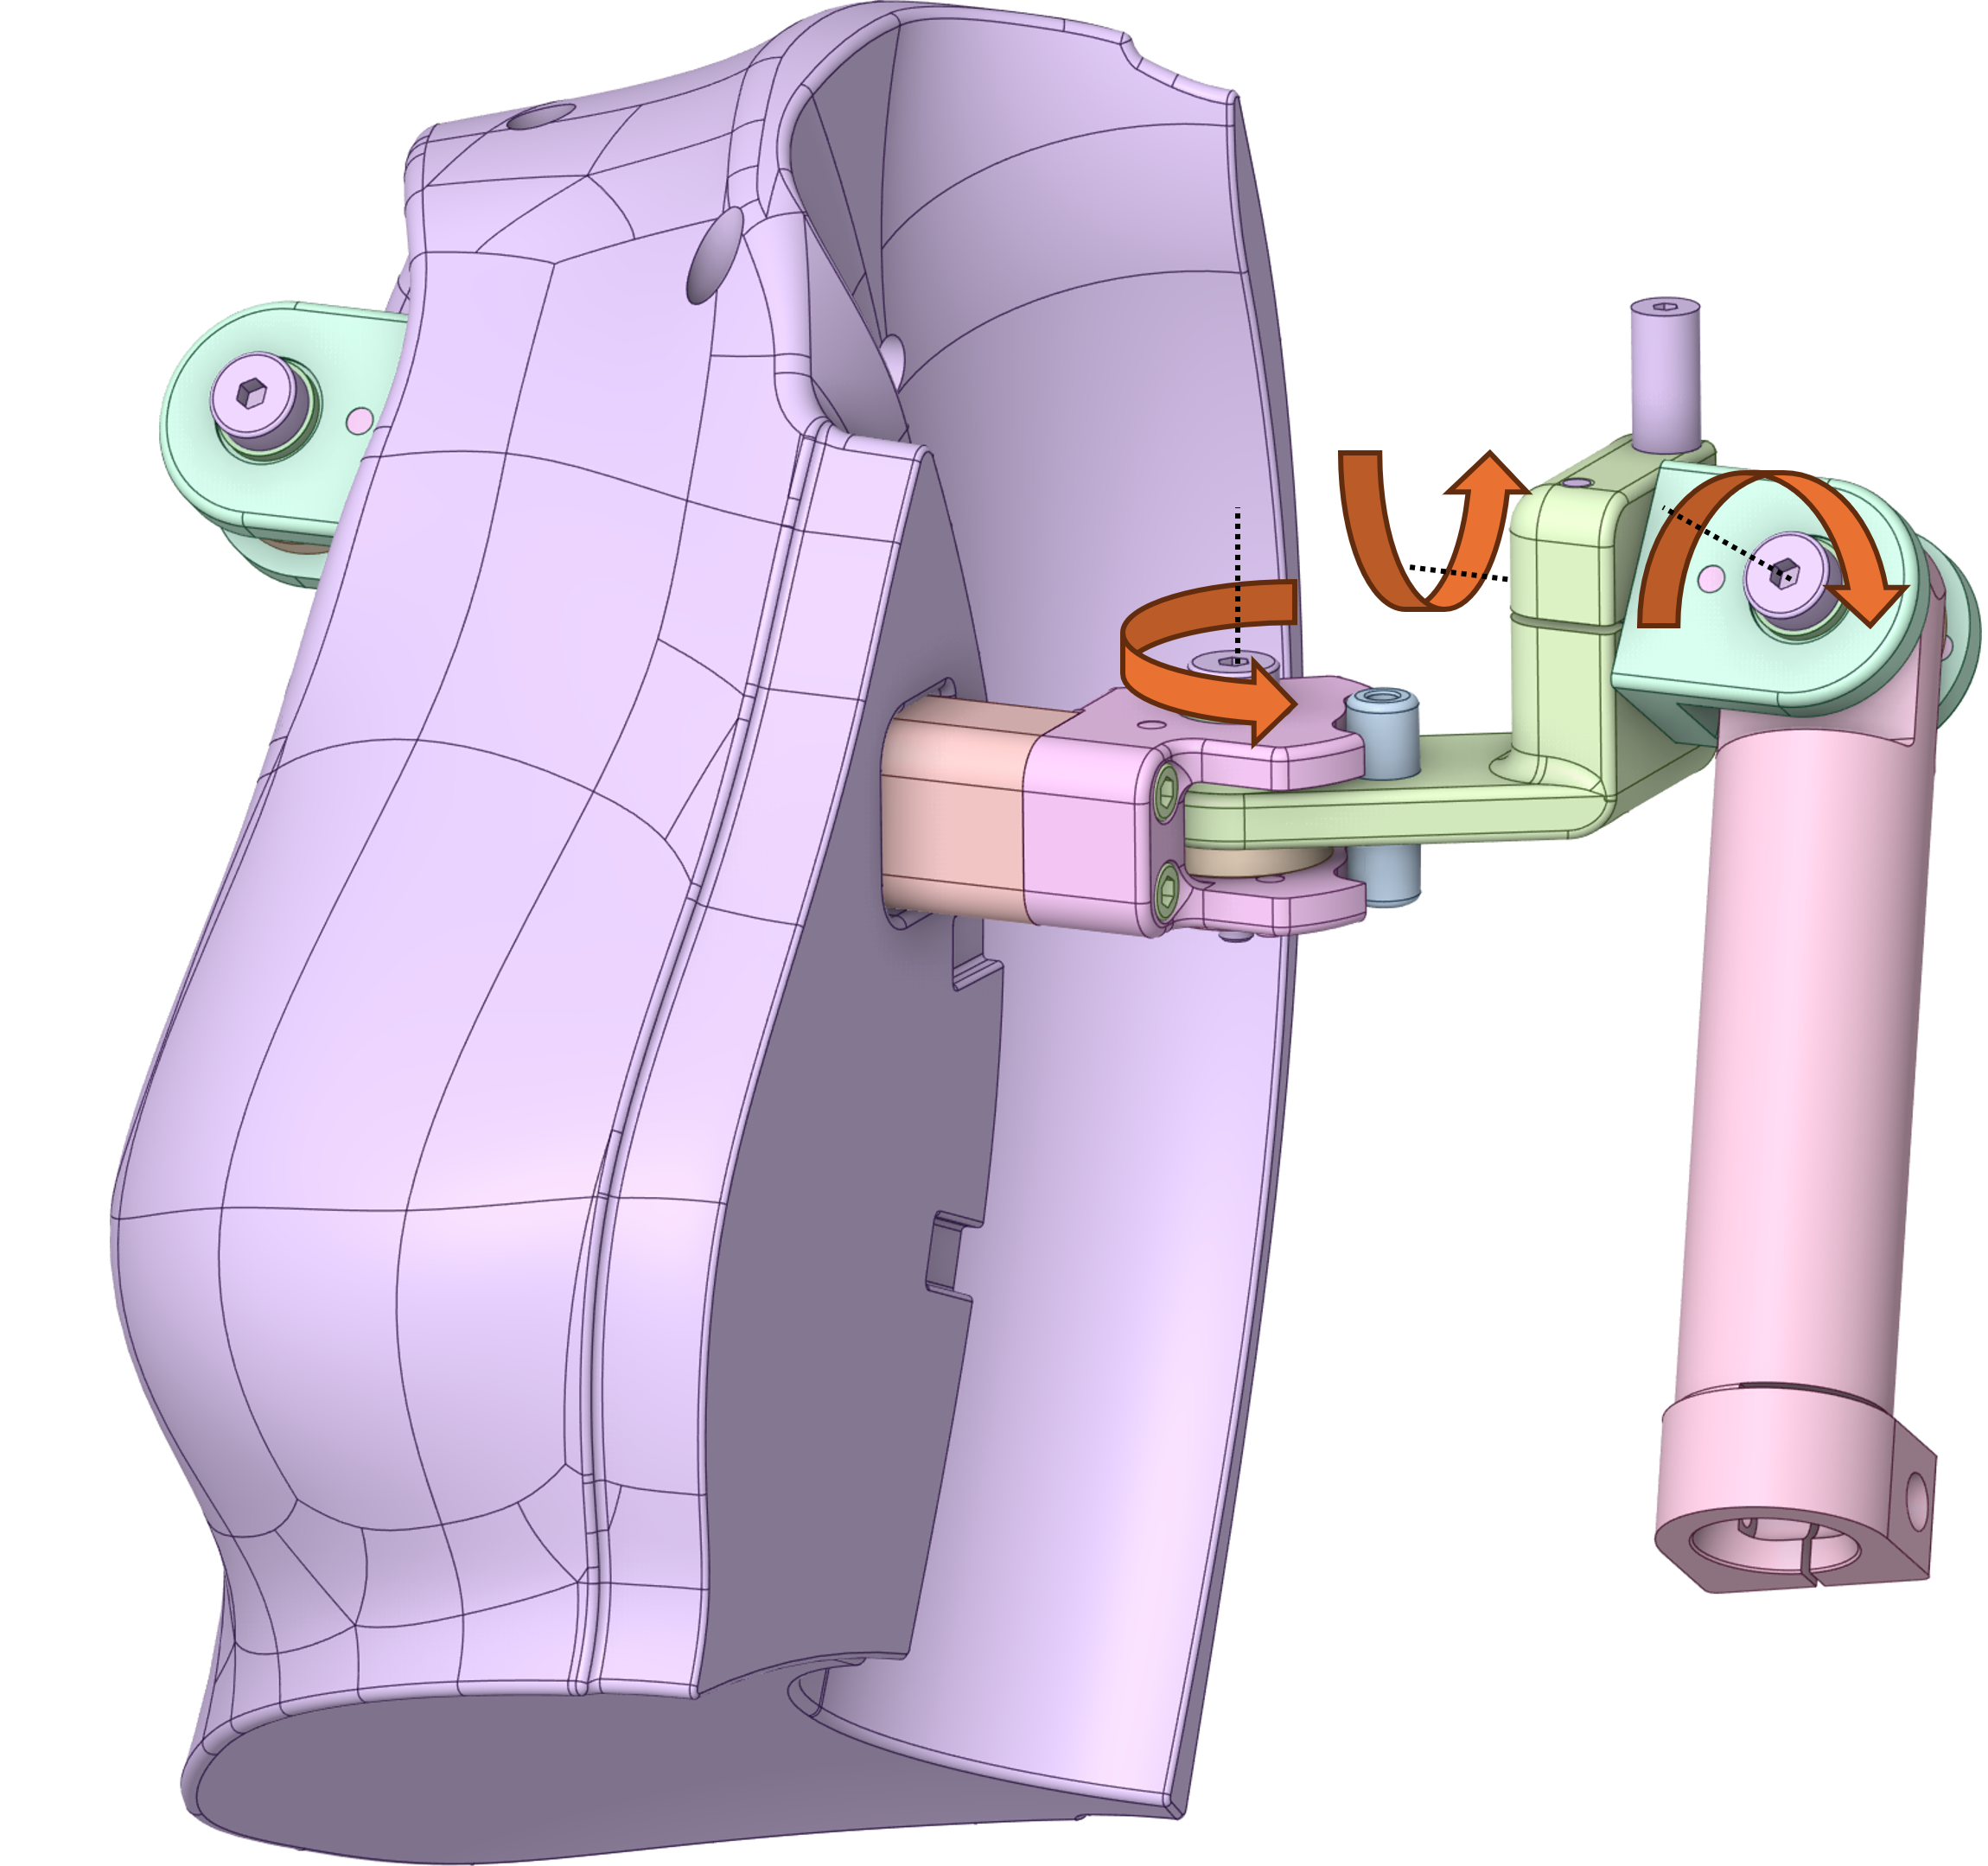
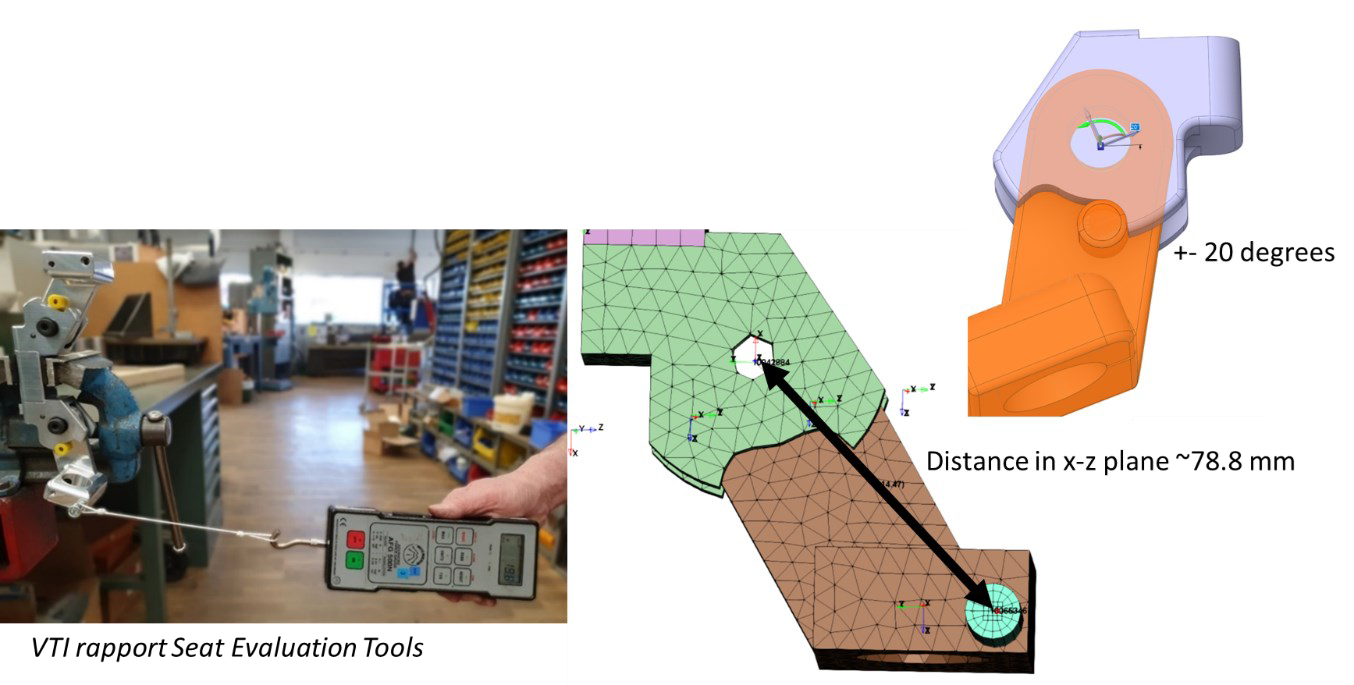
The shoulder mechanisms consist of three joints as shown below. The two outer joints represent the glenohumeral joint and are assigned a torsional resistance of 8 Nm. The innermost joint, representing the sternoclavicular joint, was quantified by measuring a pull force of 26 N at the end of the shoulder1 (see figure below). This force corresponds to a torsional resistance of 1.6 Nm, which is assigned to the joint. Based on the CAD, stop angles of ±20 degrees are assigned to this joint.
Joints in the upper and lower extremities, with a relatively large range of motion but less significance to neck and spine kinematics, are all assigned a torsional resistance of 8 Nm. The exceptions are the ankle joints, which use a lower value of 2.5 Nm, and the hip joints, which use a higher value of 30 Nm.
Neck Model
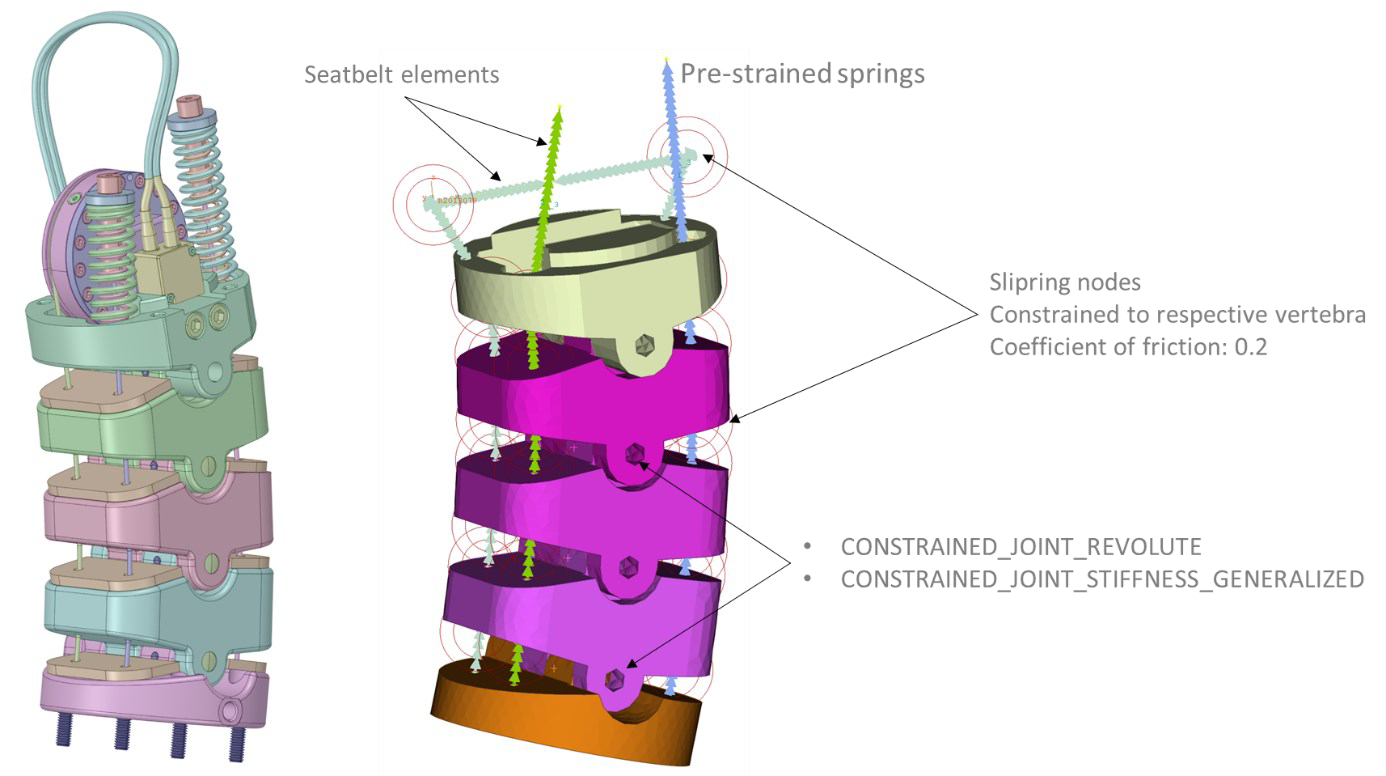
In the SET, the joints between the neck vertebrae are low-friction revolute joints. The neck's stiffness is provided by a multi-component system. This system includes two springs and a damper (located within the head and mounted on the top vertebra) and soft rubber material filling the gaps between vertebrae. Cables connect to the springs, pass through the damper and neck vertebrae, and anchor at the lowest vertebra (see left figure below).
The FE SET includes models of the two springs, the damper, revolute joints and cables (see right figure below). Modelling of the cables, springs and damper is described in the two following paragraphs.
The cables are modelled with 1D seatbelt elements, connected to slipring nodes that are constrained to each vertebra. A coefficient of friction of 0.2 is applied to both the sliprings and the revolute joints. The cable seatbelt elements are given stiffness and mass properties representing a steel wire composed of seven strands of 2 mm cable, equivalent to a mass per unit length of 1.47e-5 kg/mm and a stiffness of 59.69 kN.
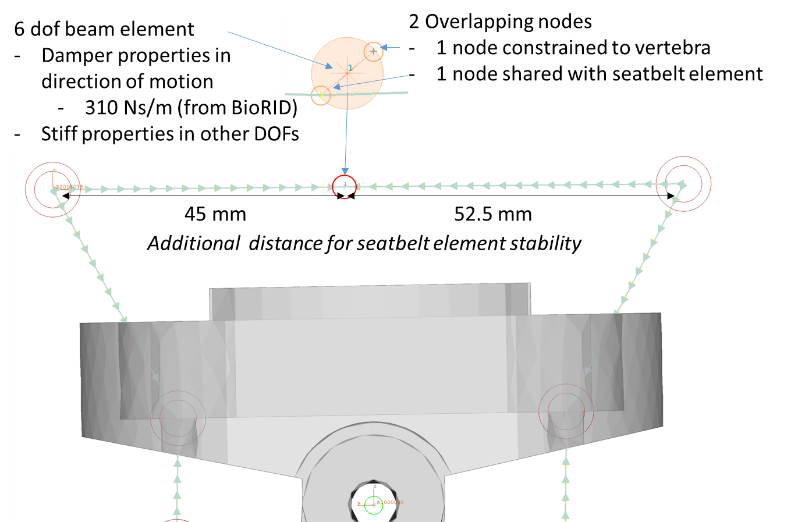
The damper is modelled as a linear damper (shown below). It consists of two nodes originally sharing the same position: one node constrained to the top vertebra, and the other attached to a node in the seatbelt element running over the top vertebra (as seen in the figure). The property of the damper was taken from the BioRID2, with a stiffness of 310 Ns/m.
The two springs are modelled with 1D spring elements. Their base node is constrained to the top vertebra, and the other node is shared with the top-most node of the cable. Stiffness properties and neutral (unloaded) lengths were taken from the VTI report1. Based on the spring's compressed length from the CAD data, an initial force for each spring was calculated and assigned, according to the tables below.
| FE SET 50F | ||||
|---|---|---|---|---|
| Spring stiffness [N/mm] | Neutral Length [mm] | Compressed length [mm] | Initial Force [N] | |
| Anterior Spring | 7.8 | 84 | 75.6 | 65.5 |
| Posterior Spring | 13.4 | 63.6 | 59.4 | 56.3 |
| FE SET 50M | ||||
|---|---|---|---|---|
| Spring stiffness [N/mm] | Neutral Length [mm] | Compressed length [mm] | Initial Force [N] | |
| Anterior Spring | 9.8 | 81.2 | 73.2 | 78.4 |
| Posterior Spring | 16.8 | 65.6 | 61.1 | 75.6 |
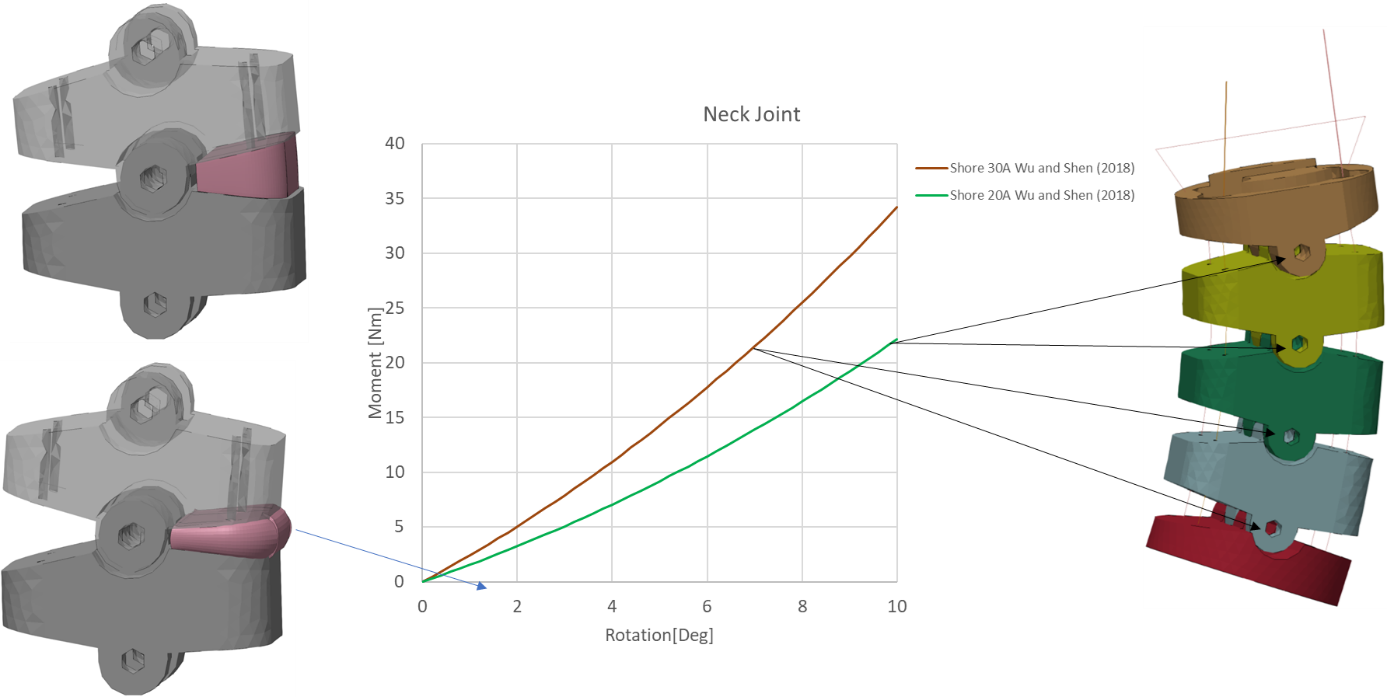
The material properties of the soft rubber material filling the gaps between the vertebrae have not been quantified experimentally but was estimated using a model consisting of two neck vertebrae and an intervening Mooney-Rivlin material. The parameters were taken from published data of rubber material with Shore value of 20A3.
| Mooney-Rivlin parameter | c10 | c01 |
|---|---|---|
| Shore 20A | 0.09 | 0.032 |
Static implicit simulations within LS-Dyna were performed to quantify the rotational stiffness of the neck joint by measuring the torque-rotation response.
Static component testing of the neck of the SET 50F was used to tune the joint stiffness', shown below. The isolated spine and neck was attached to a table at the T1 vertebra and a weight was hanged at the C0 vertebra. The displacement of the neck was compared to simulations of the setup by visual comparison, and the results will be made available when they have been published. No weight, 6kg and 12.9kg were used to evaluate the spine stiffness.
The simulated neck joint stiffness' were scaled with a factor 0.3 for the best agreement with the static bending tests.
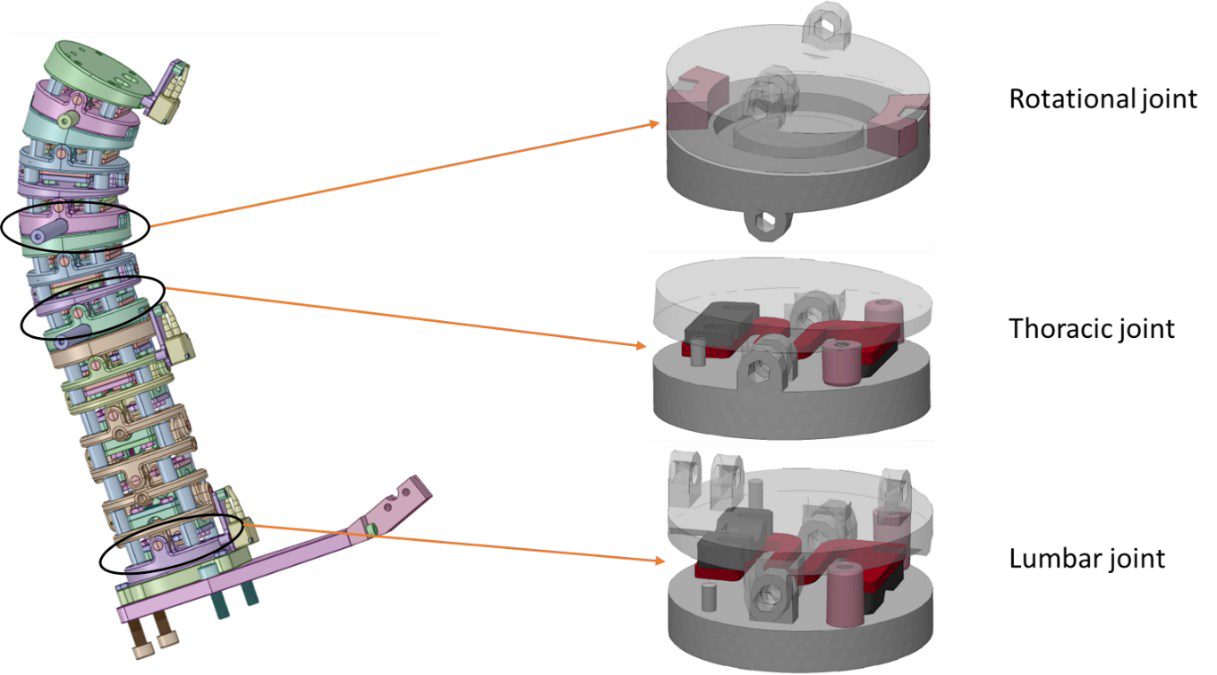
Lumbar and Thoracic Spine joints
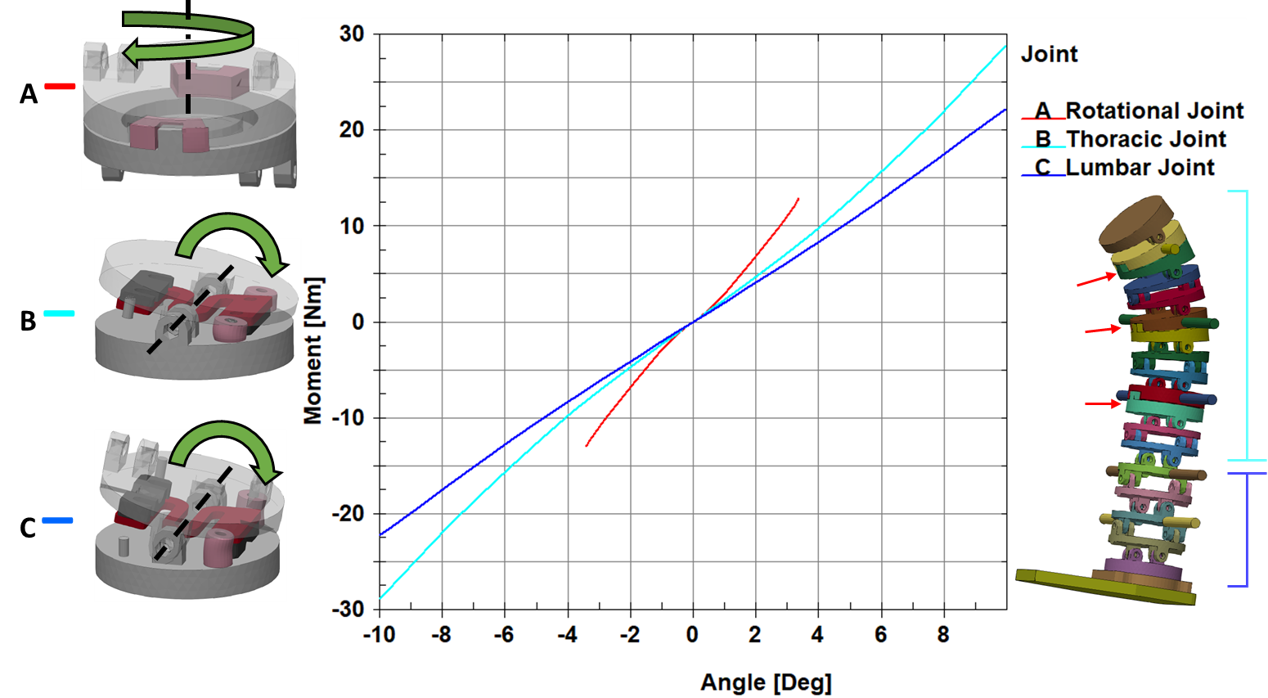
The thoracic-lumbar spinal column in the FE SETs has three repeated joint types: an axial rotational joint, a bending joint for the thoracic region, and a bending joint for the lumbar region. These joints are located in the same positions in both the FE SET 50F and FE SET 50M, with the exception of one joint at the lumbar-thoracic transition. The difference in overall spinal height between the two models is due to differently sized vertebrae. Only the FE SET 50F was used to quantify and validate the stiffness properties.
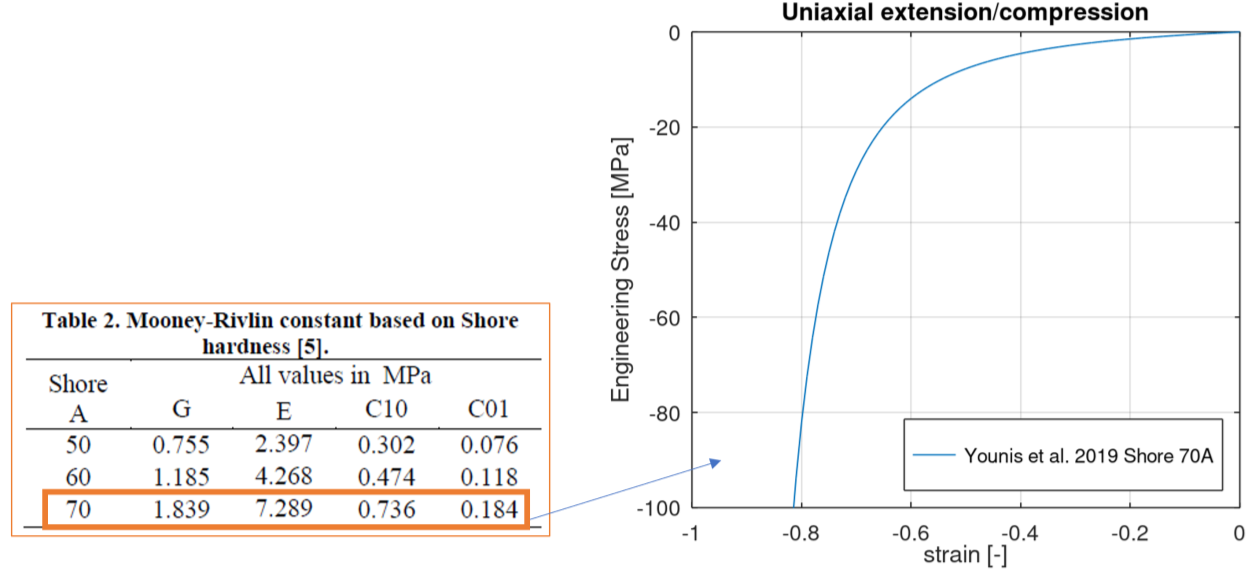
To quantify the joint stiffnesses’, the three joints were modelled in more detail with the spring (in red) and the rubber material (in pink) attached to the two rigid metal plates. The spring was modelled with linear elastic material properties corresponding to steel (200 GPa). The rubber was modelled as a hyperplastic material using a Mooney-Rivlin model. The parameters for the Mooney-Rivlin rubber were taken from published experimental data4 for rubber with a Shore 70A hardness (as shown below).
Static implicit simulations were performed in LS-Dyna to quantify the relationship between torque and rotation for each joint type (see plot below). These curves were used as the baseline joint stiffness for both FE SET models and were subsequently tuned to match the experimental data described below.
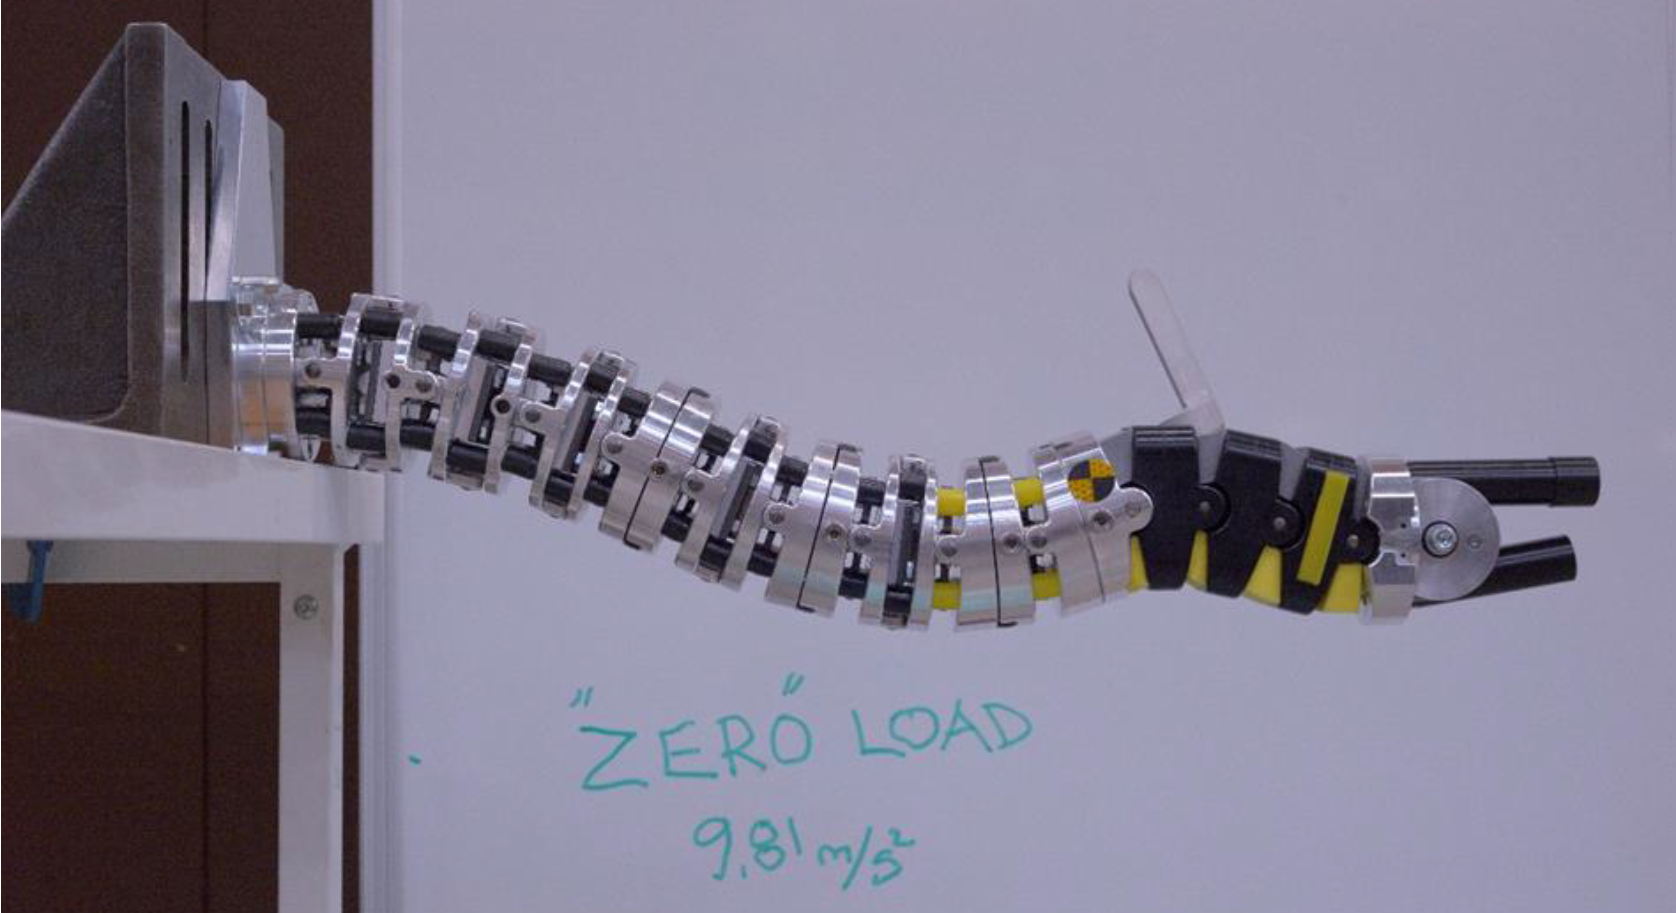
The joint stiffnesses of the SET 50F spine were tuned using a static component test (shown below). The isolated neck and spine was secured to a table with the pelvis attachment plate. A load was applied by hanging a weight from the T1 vertebra (0 kg, 3 kg, and 6 kg). The resulting displacement was visually compared with simulation results, and the results will be made available when they have been published.
For the best agreement with the static bending tests, the baseline joint torque-rotation curves were increased by a factor of 1.2.
Mass Distribution
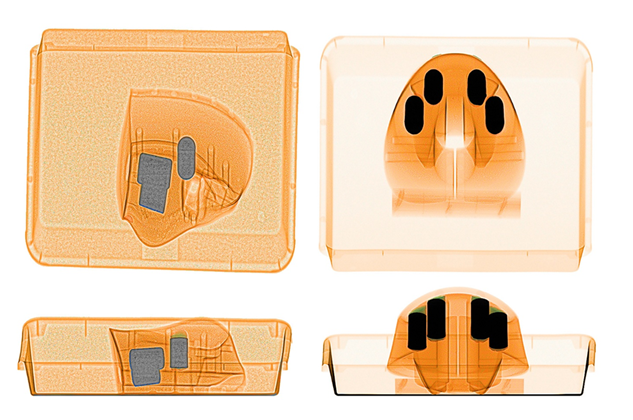
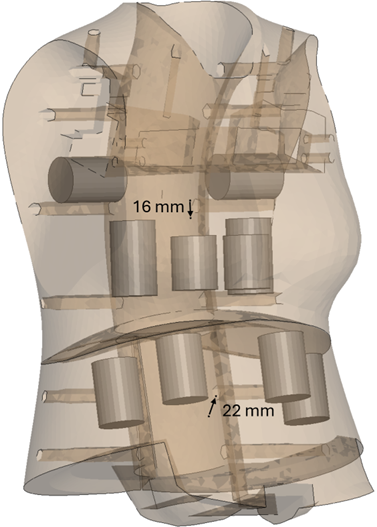
The SETs include solid lead cylinders within the chest and abdomen PUR foam to adjust the mass. As the cylinders are missing from the CAD and their location is unknown, they are not directly modelled in the FE SET. Instead, the target mass was achieved by increasing the foam density (see table under section PUR Foam). However, this method does not account for possible CoG shift caused by the lead cylinders. To determine these shifts, X-ray images (all available here; F50 example below) were inspected. 3D cylindrical rod models were created based on the visual locations in the X-rays. This specific model (image below) was used only to determine the lead cylinders' effect on mass distribution and estimate the CoG location. For this model, the chest CoG is moved approximately 16 mm downwards, and the abdomen CoG is moved approximately 22 mm forward and upward due to the cylinders.
Measured Mass
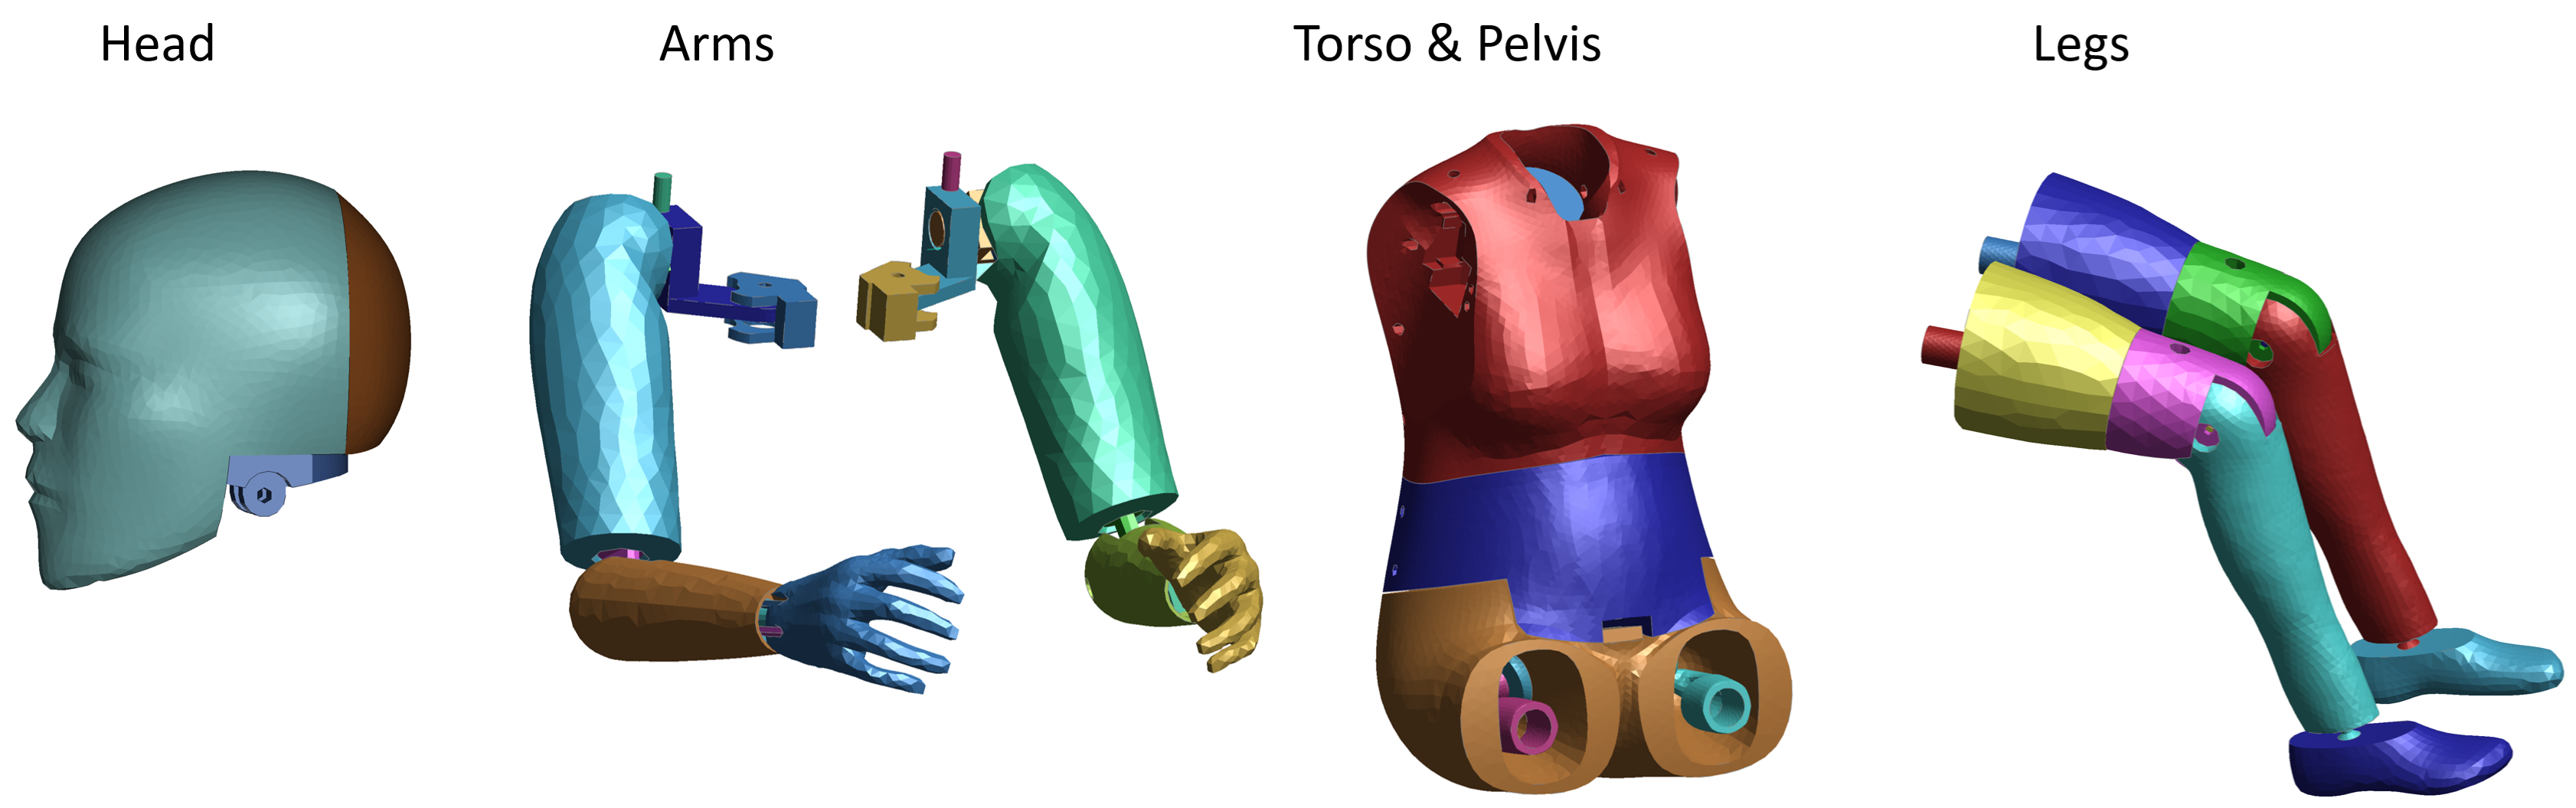
The masses of a selection of body regions of the SETs have been measured and are shown in the figure and table below together with the corresponding mass of the FE SET model.
| Body region | SET 50F | FE SET 50F | SET 50M | FE SET 50M |
|---|---|---|---|---|
| Head | 3.88 kg | 3.88 kg | 4.40 kg | 4.40 kg |
| Arms | 5.26 kg | 5.26 kg | 9.55 kg | 9.50 kg |
| Torso & Pelvis | 37.57 kg | 37.57 kg | 39.85 kg | 39.90 kg |
| Legs | 15.96 kg | 15.96 kg | 23.46 kg | 23.41 kg |
| Total | 62.7 kg | 62.7 kg | 77.3 kg | 77.3 kg |
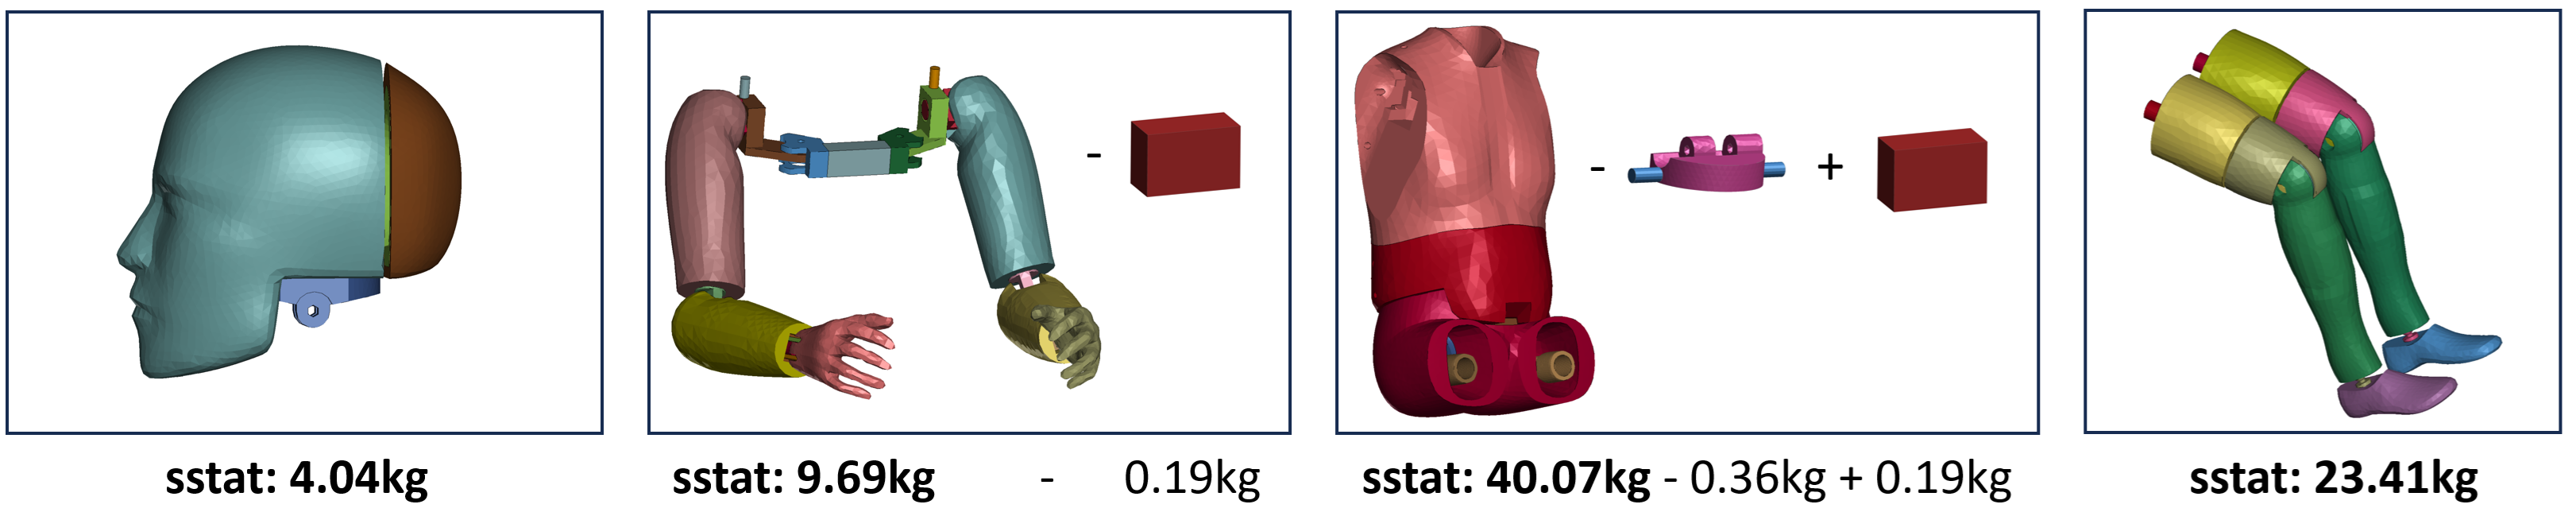
The masses can be measure using (*DATABASE_SSSTAT_MASS_PROPERTIES) from the Binout sstat. But due to the constraints in the model, all body regions cannot be measured directly from the defined part sets, but have to be calculated according to the figure below.
Calculation of mass 50F
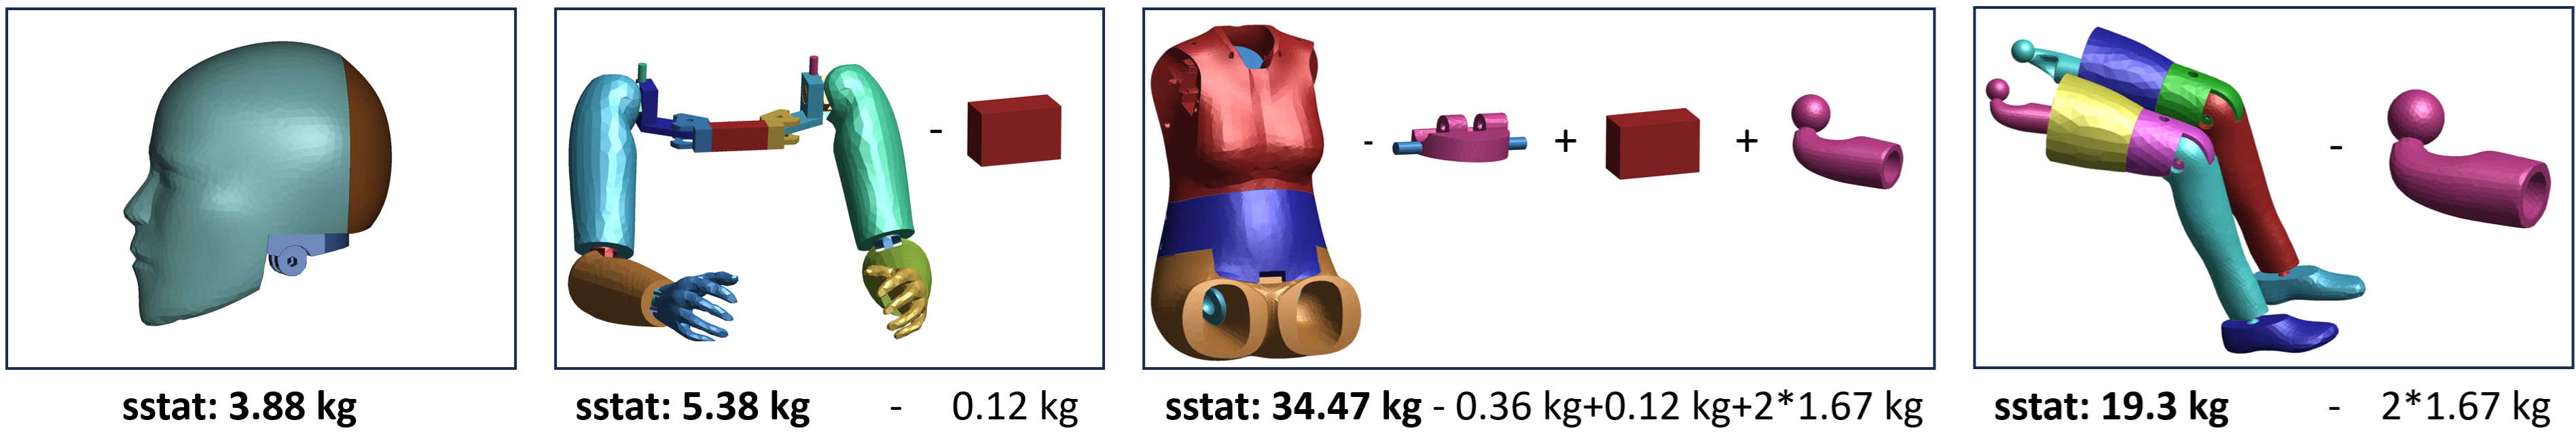
Calculation of mass 50M
-
Magnus Karemyr, Tommy Pettersson, Mats Svensson, and Astrid Linder. Seat Evaluation Tools (SETs) : Development of prototype concepts of the SETs of an average female and male for low severity rear impact crash testing. Technical Report 1147A, Swedish National Road and Transport Research Institute (VTI), Traffic Safety and Traffic System, 2022. URL: https://vti.diva-portal.org/smash/get/diva2:1709745/FULLTEXT01.pdf. ↩↩
-
Johan Davidsson. BioRID II Final Report. Technical Report, Chalmers University of Technology, 12 1999. URL: https://webfiles.ita.chalmers.se/~mys/BioRID/BioRIDIIFinal.pdf. ↩
-
Ya Yong Wu and Jing Jin Shen. A Tactile Sensor for Measuring the Hardness of Soft Materials. In 2018 IEEE International Conference on Mechatronics, Robotics and Automation (ICMRA), volume, 141–144. 2018. doi:10.1109/ICMRA.2018.8490546. ↩
-
Karem M. Younis, Adnan I. Aljarjary, and Jalil J. Shukur. Analysis of Filling Capacity during Rubber Pad Sheet Metal Forming Process. International Journal of Research, 6(10):384–389, 2019. URL: https://journals.pen2print.org/index.php/ijr/article/view/19391. ↩